Colorful Analytics: A Visual Language for Modern Business
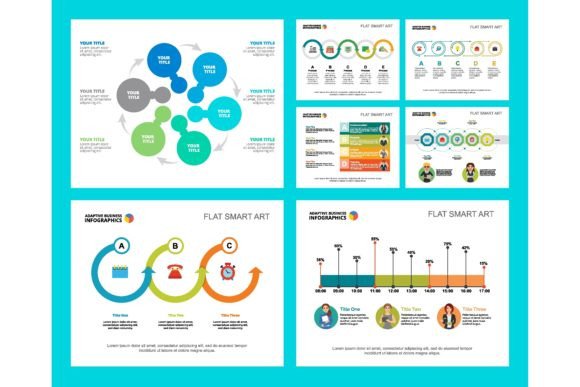
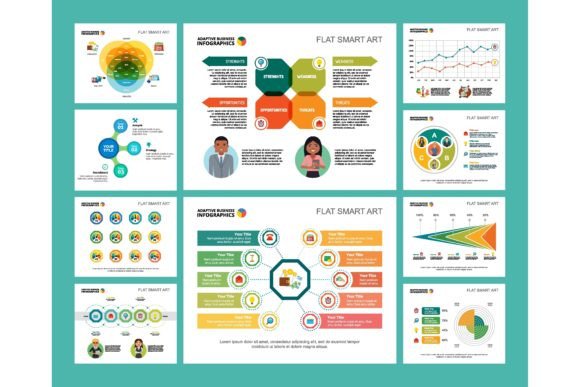
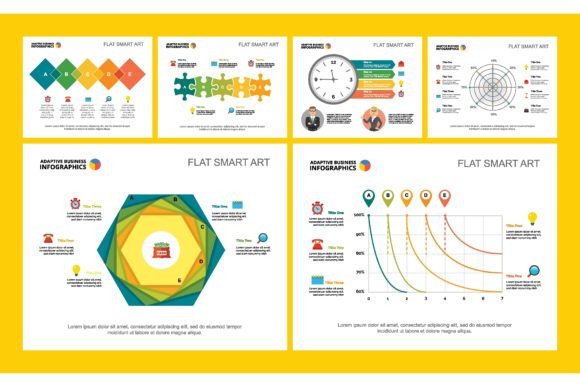
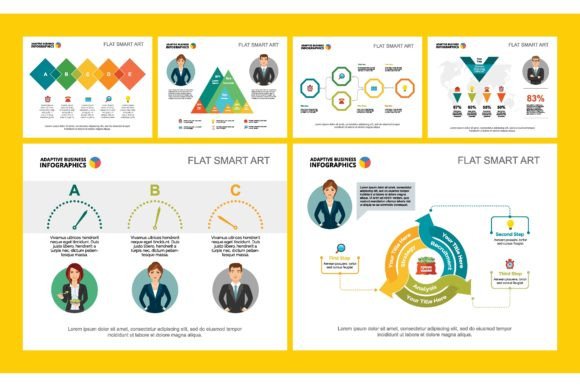
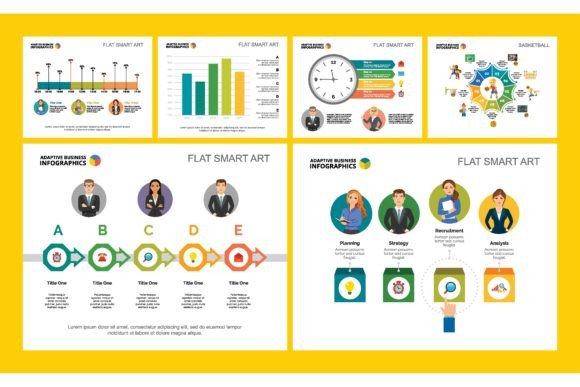
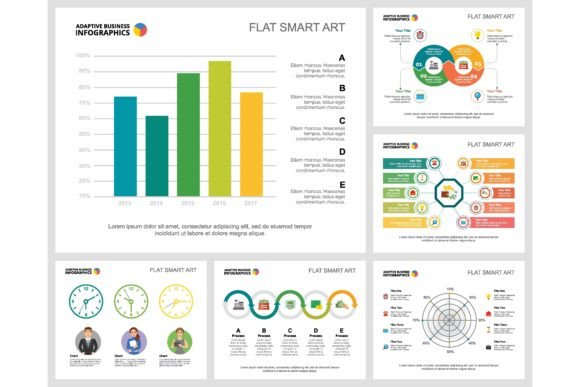
In the world of business communication, clarity is king, but engagement is its queen. We've all sat through presentations where dense data slides put the audience to sleep, or read reports where key insights were buried under monotonous gray charts. This is the problem the Colorful Analytics or Consulting Concept was designed to solve. It's more than just a set of pretty charts; it's a complete visual philosophy for transforming complex information into compelling, memorable stories. Think of it as a toolkit that bridges the gap between raw data and human understanding, using vibrant color, intuitive layout, and modern typography to make business intelligence not just digestible, but genuinely interesting.
The Anatomy of a Colorful Approach
At its core, the Colorful Analytics concept is built on a foundation of strategic color psychology and clean, modern design. The visual personality is confident, optimistic, and professional without being stuffy. You won't find harsh neons or overwhelming gradients here. Instead, the palette typically uses a balanced spectrum—a primary bold color for key metrics, complemented by softer secondary and tertiary hues for context and categorization. This isn't random decoration; each color is chosen to guide the viewer's eye, create instant visual hierarchies, and encode meaning. A rising revenue line in a vibrant teal feels inherently more positive and dynamic than the same line in a standard gray.
The style leans heavily into modern typography, pairing clean sans serif font families for body text and labels with occasional use of a distinctive display font for headlines. This combination ensures maximum readability across screens and print while allowing key sections to pop with personality. The layouts are grid-based and modular, offering a sense of order and professionalism. Whether it's an infographic chart breaking down market share, a workflow diagram illustrating a consulting process, or a financial report template, every element has breathing room. This thoughtful spacing reduces cognitive load, making even dense information feel approachable. The overall appeal is one of organized energy—it feels dynamic, insightful, and forward-thinking.
Where This Visual System Shines: Real-World Applications
The true strength of the Colorful Analytics concept is its remarkable versatility. For designers and marketers, it's a goldmine for creating social media graphics and presentation slide templates that stop the scroll. A data-driven Instagram carousel using these vibrant charts can explain a complex marketing funnel in a way that’s instantly graspable, driving higher engagement and shares. For entrepreneurs and small business owners, applying this visual language to pitch decks, annual reports, and brochure design materials instantly elevates brand perception. It communicates that you are data-informed, modern, and serious about clarity—key components of building trust with investors and clients.
For content creators and bloggers, the infographic elements are invaluable. They can transform a listicle into an interactive visual guide or turn research findings into a shareable asset that boosts authority and audience engagement. In editorial design, such as magazines or digital publications, these charts can break up long-form text and highlight key statistics, improving reader retention. Even in packaging design or logo design for tech-forward brands, the color palettes and geometric shapes inspired by this concept can inform a cohesive and intelligent brand identity. It’s a system that works across digital, print, commercial, and personal projects, from a freelancer's invoice to a corporate's quarterly briefing.
Practical Guidance: Implementing the Concept in Your Projects
Adopting the Colorful Analytics or Consulting Concept is less about finding one specific premium font and more about embracing a design mindset. Start by evaluating your project's core message. If you're presenting financial data to a board, you might use the concept's bold accent color sparingly to highlight profit margins against a neutral background. For a startup's investor brochure, you could employ the full spectrum of the palette to illustrate different business segments, creating a vibrant yet organized font pairing of a clean sans serif for explanations and a subtle script font for pull quotes.
When selecting your actual design assets, look for templates or chart libraries that offer this kind of flexible, colorful system. Test font pairings rigorously. The concept's modern typography works best when the display font doesn't overpower the data. A good rule is to use the more stylized typeface for section headers only, ensuring the body text remains highly legible. Always consider readability on the intended medium; a color that looks stunning on a printed brochure might lose contrast on a mobile screen.
Finally, think about consistency and commercial licensing. If you're building a brand identity, document the exact color codes, font styles, and chart templates you choose to create a style guide. This ensures every piece of communication, from a web design element to a printed financial report, feels unified. The goal is to use this colorful, analytical visual language not as a one-off gimmick, but as a sustainable part of your communication toolkit. It’s about making the complex clear and the mundane engaging, turning every presentation, report, or social post into an opportunity to connect with your audience through intelligent, beautiful design.